
July 20, 2026: price $346.77, downtrend, RSI 42.5, support 337.39, resistance 370.92. Google stock technical analysis. GOOGL Stock Drops – complete…
For global portfolios, Alphabet isn’t just another ticker symbol—it’s one of the heaviest weights in global equity indices, so its current decline is quietly dragging down index funds from New York to Jakarta. Stocks fell 2.17% to $346.77 in the latest session, according to stock data via Yahoo Finance (July 17, 2026), the monthly decline continued 4.68% and investors are wondering whether this is a pause or the start of something deeper.
Trend and price action
The trend, frankly speaking, is downward. The price is sitting below the 20-day simple moving average (SMA20) at 355.90.which in itself falls by about -0.55% for five daysand significantly lower SMA50 at 370.59. A moving average is simply the average closing price over a given period – when the price is trading below both the short-term and intermediate-term lines, it suggests that recent buyers are, on average, underwater. Eat no new MA-crossbut nothing is needed: the 20-day line is already below the 50-day, the bearish alignment that preceded the current decline.
The price now is only 28% of 20 day rangehugging the bottom end. In Bollinger Bands – volatility envelopes draw two standard deviations around the mean – %B reading 24% confirms that the stock is approaching the lower band at 338.27as shown in the graph. It is noteworthy that this stripe is located almost exactly at the top 20-day support at 337.39.creating the confluence shelf where bargain hunters tend to show up.
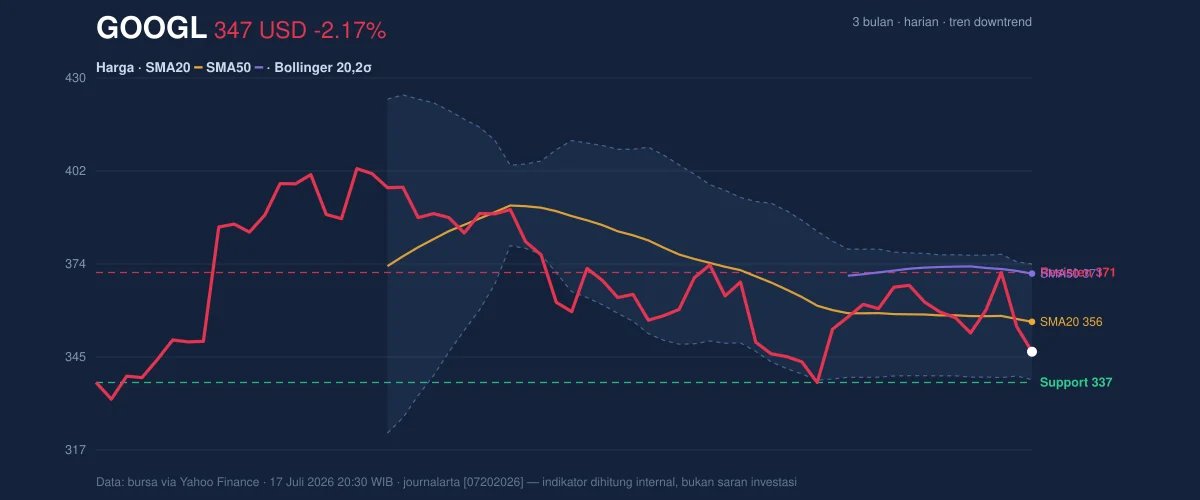 GOOGL 3 Month Price Action Chart: Price, SMA20/50, Bollinger, Support and Resistance. Data: exchange via Yahoo Finance.
Oscillators and momentum
The impulse sends a message of schism, and schism is a story in itself. RSI and 42.5 (Relative Strength Index, a measure of recent profits and losses from 0 to 100) Neutral: Weak, but far from capitulating below 30, which would indicate unsuccessful sales. Stochastic is oversold: %K at 17.6 versus %D at 55.1. – the fast line has collapsed well below the slow line, which means that short-term selling is extended and a reflexive rebound is statistically likely.
The most interesting is the MACD, which tracks the gap between two moving averages. The line is on -2.312 versus signal -2.359producing histogram +0.047 – first positive tick. Both lines remain below zero, so the downtrend continues, but the rate of decline is slowing. As the momentum chart shows, this is an attempt to stabilize within a downtrend rather than a reversal.
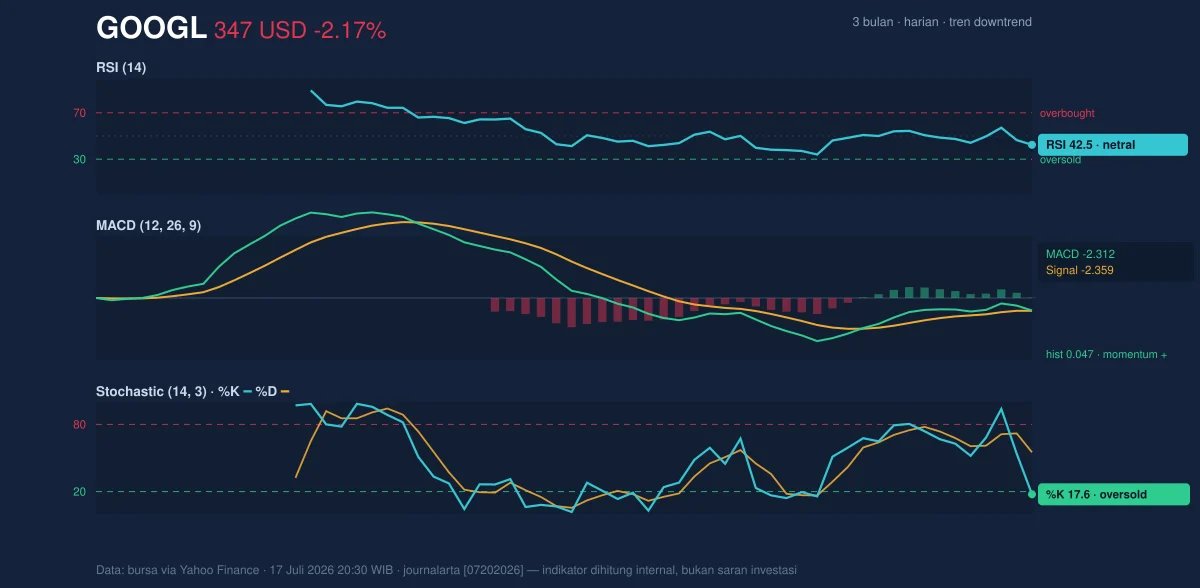 GOOGL momentum chart: RSI(14), MACD, stochastic. Data: exchange via Yahoo Finance.
Volatility and Volume
Volatility is not panic. The bandwidth is normal 9.9%And ATR 11.07 – about 3.2% of the price — means daily fluctuations of about eleven dollars are the current norm. There is no contraction signaling explosive movement and no frustration signaling expansion.
Volume, however, refuses to confirm any bottom. Last printed session 29.9 million shares compared to the 20-day average of 35.4 million – just 0.8 times regular participation. – And Balance volume, which adds volume on up days and subtracts it on down days, falls.. Translation: money is still quietly flowing out, and no institutional buyers have stepped in with size.
Key levels and scenarios
The battlefield is tight. Support is at 337.39.supported by the lower Bollinger band; underneath it, three month minimum 330.20 this is the last line before the chart opens to new lows. Overhead: SMA20 per 355.90 this is the first ceiling, then resistance at 370.92 and the upper band at 373.53. The three-month high of 408.61 remains a distant memory.
If price holds the 337 shelf and retraces the 355.90 level with volume, mean reversion to 370.92 becomes plausible. If 337.39 breaks on rising volume, expect a quick test of 330.20 – one ATR will cover that distance in one day.
Technical Verdict: HOLD
Verdict HOLD (let’s wait and see). There are three reasons:
– The trend is downward – the price is below the SMA20 and SMA50, with the short average sloping lower, meaning that buying here is fighting the tape.
– Stabilization not confirmed — A positive MACD histogram and an oversold stochastic hint at a rebound, but the RSI at 42.5 shows there has been no genuine capitulation.
– Sellers still control participation — The fall in OBV and the increase in volume by 0.8x means that there are no signs of accumulation yet.
The verdict is invalid if the price falls below 337.39which would expose the 330.20 level and reverse the slope; a close above 355.90 will improve the situation to positive.
– Input range: 337.39 – 338.27 (support shelf/lower merge strip, only at stabilization signs)
– Goal Exit: 355.90 first (SMA20), then 370.92 (range resistance)
– Stop loss: below 330.20 (below three month low)
This is technical analysis and not investment advice; Site disclaimer applies.
For non-traders, the ball is still in the hands of the sellers, the buyers are standing quietly at the door, and in the markets, as the old saying goes, “patience is an attitude.”
GOOGL Summary Data
| Last price | US$346.77 |
| Change 1 day/5 days/1 month | -2.17% / -2.91% / -4.68% |
| Trend/MA-cross | downtrend / no |
| SMA20/SMA50 | 355.90 / 370.59 |
| RSI (14) / Stochastic %K | 42.5/17.6 |
| Bollinger %B / ATR | 24% / 11.07 |
| Support/Resistance 20 days | 337.39 / 370.92 |
| Data as of | 17 July 2026 20:30 IWST |