

At the end of June, shares of online broker Robinhood successfully reversed a downtrend that had lasted several months, thereby providing a bullish continuation signal. The first target price of $120.50 has already been reached. At the same time, the process of reaching the bottom, which ended in the spring, suggests further growth potential and perhaps even new record highs. Thus, the stock continues its long-term upward trend, further highlighting the positive technical chart picture. Investors who followed the June 26 analysis should now move their stop losses to the area of the two moving averages (50-day and 200-day lines) to protect profits already made.
Possibility of purchase:
If Robinhood shares manage to sustainably break above $120.50, the next price target should be around the December high of $139.30. Above this, a larger resistance area awaits around the previous record high at $153.01, breaking through which could generate a new buy signal. On the downside, the 50-day and 200-day moving averages around $90.00 form a key support zone. If the stock price falls below this level for an extended period, the technical chart picture will become murkier and the potential for a correction will increase to $63.29. Regardless of the positive overall trend, investors should always take interim consolidations into account.
Daily chart:
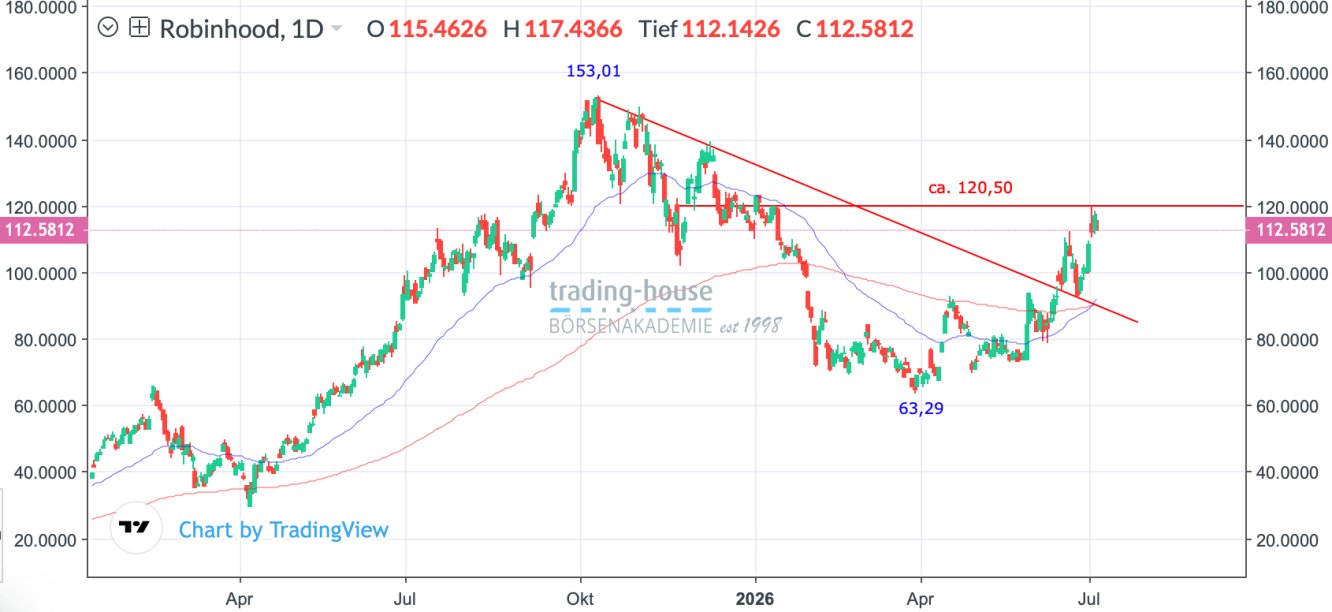
.; Daily, local time (GMT+1); The index price at the time of preparation of the analysis was $112.58; Trading place: New York Stock Exchange 22:00